How to read your LinkedIn analytics (and the three numbers worth watching)
What impressions, members reached and video views actually count, in LinkedIn's own words. Which metrics tell you something, and what the dashboard never shows.
- analytics
- metrics
- reach
What do LinkedIn's post metrics actually mean?
Less than their names suggest. LinkedIn defines impressions as the number of times your post was shown on LinkedIn, and members reached as the number of distinct members and Pages that saw your post, adding that this number is an estimate and does not include repeat views. One person scrolling past you five times is five impressions and one member reached.
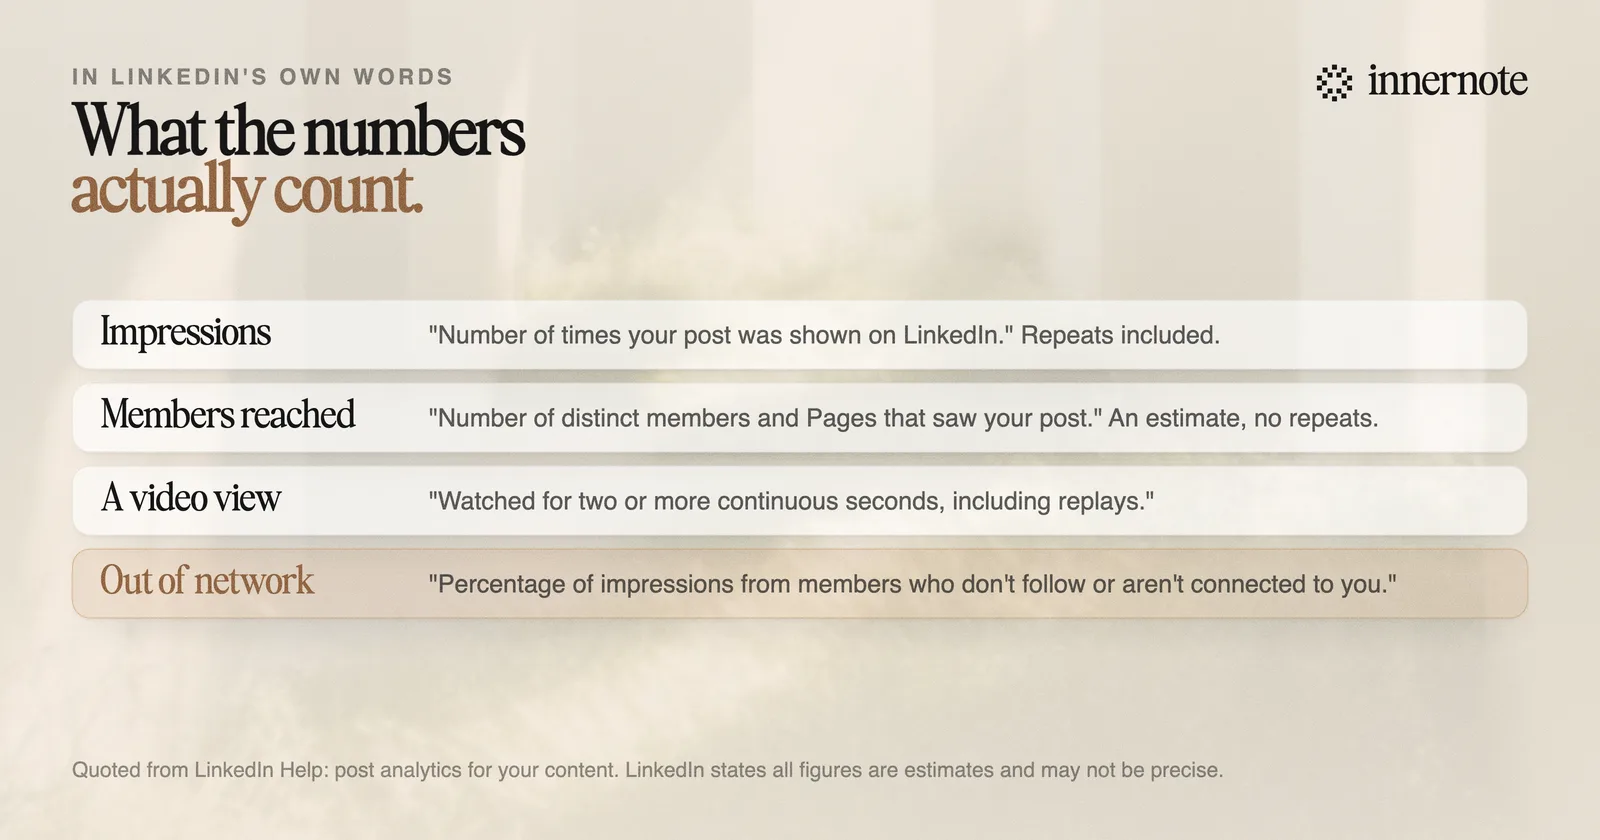
The video definition is the one that changes how you read a dashboard. LinkedIn counts a video view as the total number of times your video was watched for two or more continuous seconds, including replays. Two seconds. A video with ten thousand views may have been genuinely watched by very few people, which is why average watch time sits next to it.
Members reached has a page of its own, what members reached means, with how long LinkedIn keeps each number. The rest of the panel tells you more than the headline numbers. Saves is the number of times members saved your post. Sends on LinkedIn is the number of times members sent it to someone in a message. Both are private actions with no social payoff, which is exactly what makes them worth reading. Neither comes with names, and can you see who viewed your LinkedIn post has what LinkedIn shows in their place.
Which numbers actually matter?
Three, and impressions is not one of them. Watch the out-of-network percentage, the private actions, and what the post did to your profile. Everything else is either a proxy for those or a vanity number that moves with how many people happened to be scrolling.
- 1.Out of network, which LinkedIn defines as the percentage of impressions from members who do not follow or are not connected to you. This is the only visible number that tells you whether you reached anyone new. A post with fewer impressions and a higher out-of-network share is usually the better post.
- 2.Saves and sends. Nobody saves a post to look good. A high save count on a low-impression post means you wrote something useful and the reach was the constraint, which is a completely different problem from writing something forgettable.
- 3.Profile viewers and followers gained from this post. LinkedIn attributes both to the individual post. This is the closest thing you get to a conversion metric, and it answers the question that actually matters, which is whether the post made anyone curious about you.
Impressions mostly measure how busy the feed was. The out-of-network percentage measures whether your writing travelled, which is the thing you were trying to do.
This reframes the usual panic about falling reach. If impressions dropped while the out-of-network share held or rose, distribution got narrower and better targeted rather than worse, which is broadly what happened across the platform and is covered in why your LinkedIn reach dropped in 2026. For what a normal impression count looks like at your follower count, see what is a good number of impressions.
What does LinkedIn not show you?
A surprising amount, including engagement it counts. Metricool's 2026 study of 670,000 posts found overall engagement rising by close to 14 percent while likes and comments fell, because actions like swiping through a carousel, opening a document and clicking through to a page are all counted and none of them appear in your dashboard.
The bigger absence is dwell time. How long people spend on your post is one of the signals the ranking system reads, and there is no dwell figure anywhere in your analytics. Average watch time on video is the only close relative you are shown. We went through what is known about it in dwell time, the metric you cannot see.
Search is the other blind spot, and it lives somewhere else entirely. Search appearances sits in your profile analytics rather than your post analytics, and it is the only feedback you get on whether people can find you, which matters more since LinkedIn rebuilt search around meaning rather than keywords. That is covered in how to show up in LinkedIn search in 2026.
How far back does the data go, and can you export it?
It depends on the metric, and the windows are shorter than people assume. LinkedIn keeps discovery and engagement data for about 1,000 days, video analytics for 365 days, article data for two years, and viewer demographics for only 180 days. Nothing is permanent.
Export exists but it is modest. Post analytics can be downloaded from the analytics page, and a combined view across posts is available to everyone: LinkedIn removed the creator mode toggle in March 2024 and made those tools the default, which is covered in what happened to LinkedIn Creator Mode. There is no API for your own personal post data, which is why every third-party dashboard either asks you to upload the export or reads the page in your browser.
Two panels have their own guides now: who viewed your profile, and how to calculate an engagement rate, which LinkedIn does not compute for you. The practical habit is to export once a month and keep the file. Six months of your own numbers is worth more than any published benchmark, partly because it is actually about you and partly because published benchmarks are frequently wrong, which we demonstrated in most LinkedIn engagement benchmarks fail their own arithmetic.
One caution before you read too much into any of it. LinkedIn states plainly that these numbers are estimates and may not be precise. A 12 percent difference between two posts is noise. A post that got three times the out-of-network share of everything else you published is a signal, and it is telling you to write more of that one.
Which is where analytics stops being useful on its own. Knowing which post travelled is easy; writing four more like it without flattening back into everyone else's voice is the hard part, and it is what innernote is built for.
Quick answers
Keep going